Uses for interactive maps
From wildlife to water, recreation to ancient Rome, interactive maps span the spatial spectrum. Check out some fascinating examples of how web maps are used today.
A Better Map has had the priviledge of collaborating on several interesting web maps, indicated by this symbol.
Recreation and tourism
Hiking, biking, skiing, fishing. The modern world still needs to step out of their cubicles and enjoy the outdoors once in awhile. Interactive maps are an excellent medium for connecting people to activities and tourism.
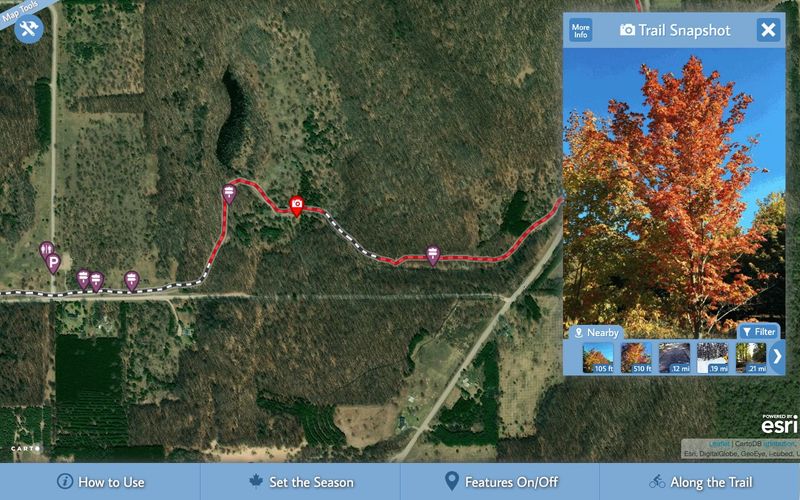
Sleeping Bear Heritage Trail
Friend of Sleeping Bear DunesThe Sleeping Bear Heritage Trail is a multi-use trail that runs over 20 miles near the Lake Michigan shore in northwest Lower Michigan. This map provides rich, detailed information about recreation and tourism options in the area.
“Sleeping Bear Dunes National Lakeshore is fortunate to have more than 700 people volunteer to work in the park each year. All volunteer activity is appreciated, but the Friends does work that can't be done by individuals. It obtains and administers grants and memorial funds which individuals, companies and other organizations wish to provide for the benefit of the park. ”
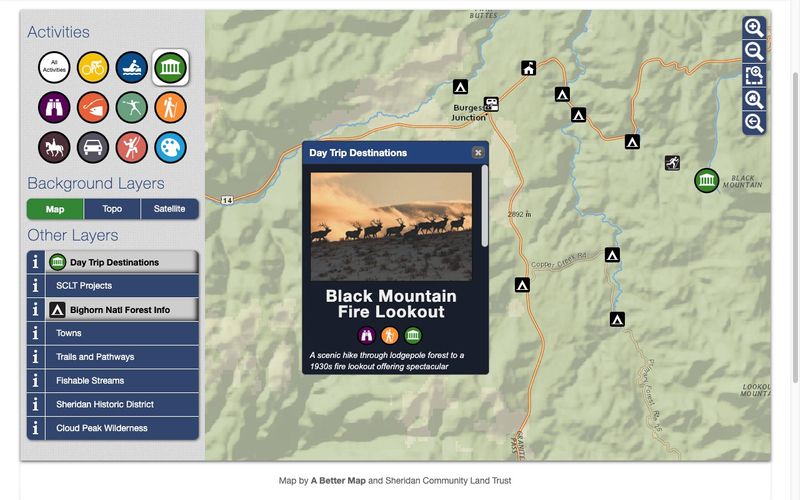
SCLT Recreation Map
Sheridan Community Land TrustThis map showcases the many recreation opportunities in and around Sheridan, Wyoming. It also highlights some of SCLT's efforts to preserve land in the form of conservation easements.
“Sheridan County is our home. ... [W]e strive to preserve our heritage of open spaces, healthy rivers and creeks, working ranches, wildlife habitat, and vibrant history, while expanding recreation opportunities to connect people with the places they love. ”
Wildlife
It can be challenging to present complex wildlife concepts like species distributions or habitat suitability in an intuitive format. Interactive maps are quite capable, however, as they handle large quantities of information, reveal spatial patterns, and provide efficient insights in an engaging and highly visual manner.
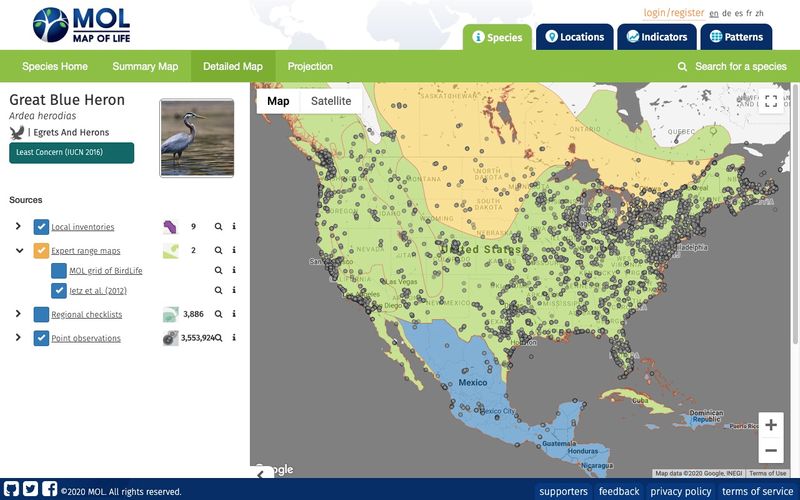
Map of Life
Map of LifeThe Map of Life assembles and integrates different sources of data describing species distributions worldwide. These data include expert species range maps, species occurrence points, ecoregions, and protected areas from providers like IUCN, WWF, GBIF, and more.
“Map of Life aims to support effective and global biodiversity education, monitoring, research and decision-making by assembling and integrating a wide range of knowledge about species distributions and their dynamics over time. ”
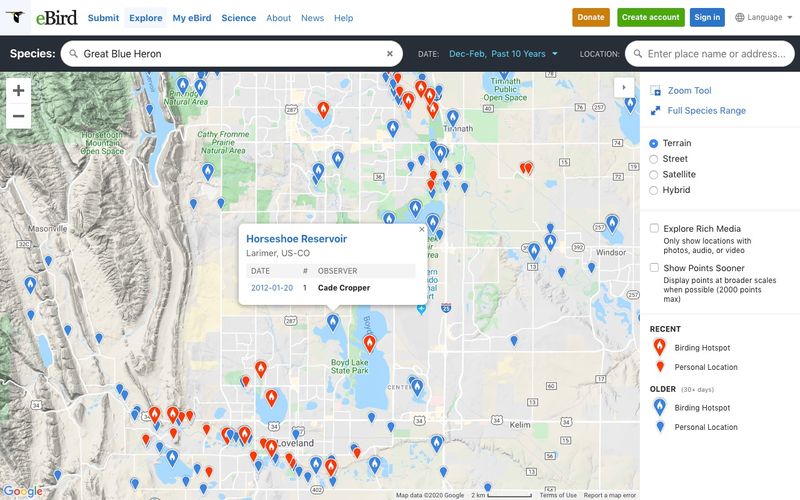
eBird
Cornell UniversityeBird is the world's largest biodiversity-related citizen science project, with more than 100 million bird sightings contributed each year by eBirders around the world.
“eBird began with a simple idea—that every birdwatcher has unique knowledge and experience. Our goal is to gather this information in the form of checklists of birds, archive it, and freely share it to power new data-driven approaches to science, conservation and education. ”
Conservation and forests
As our planet faces increasing threats to its health and balance, the need to protect it grows. Interactive maps provide excellent tools for visualizing, sharing, and analyzing a variety of conservation efforts.
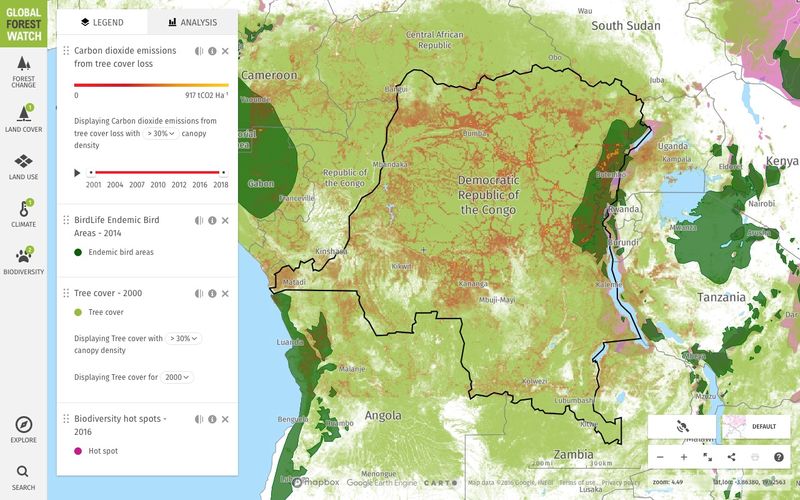
Global Forest Watch
Global Forest WatchGlobal Forest Watch (GFW) is an online platform that provides data and tools for monitoring forests. By harnessing cutting-edge technology, GFW allows anyone to access near real-time information about where and how forests are changing around the world.
“The World Resources Institute (WRI) established Global Forest Watch in 1997 as part of the Forest Frontiers Initiative. It started as a network of NGOs producing up-to-date reports about the state of forests in four pilot countries: Cameroon, Canada, Gabon, and Indonesia. ”
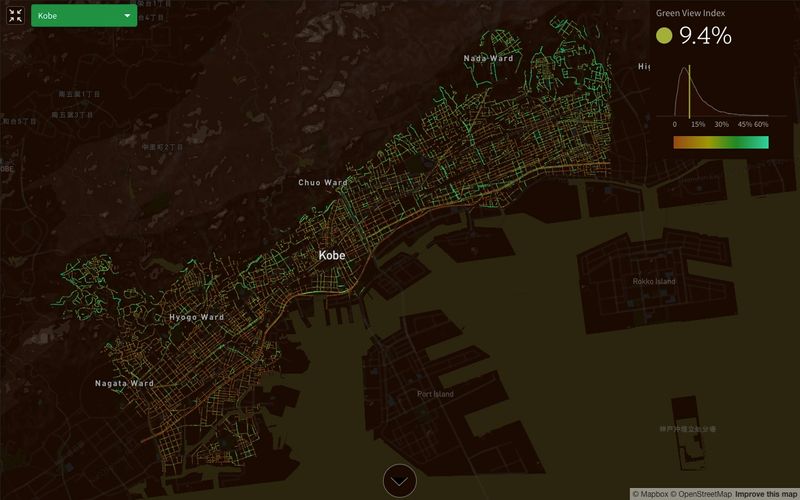
Treepedia Green Canopy Explorer
MIT Senseable City LabTreepedia measures the canopy cover in cities. Rather than count the individual number of trees, we've developed a scaleable and universally applicable method by analyzing the amount of green perceived while walking down the street.
“The way we describe and understand cities is being radically transformed—as are the tools we use to design them. The mission of the Senseable City Laboratory—a research initiative at the Massachusetts Institute of Technology—is to anticipate these changes and study them from a critical point of view. ”
Climate change
Regardless of which side of the, uh, "heated" discussion you are on, climate change is happening. From melting glaciers to rising seas, interactive maps allow us to analyze the ever-changing impacts and make informed decisions about how we can help.
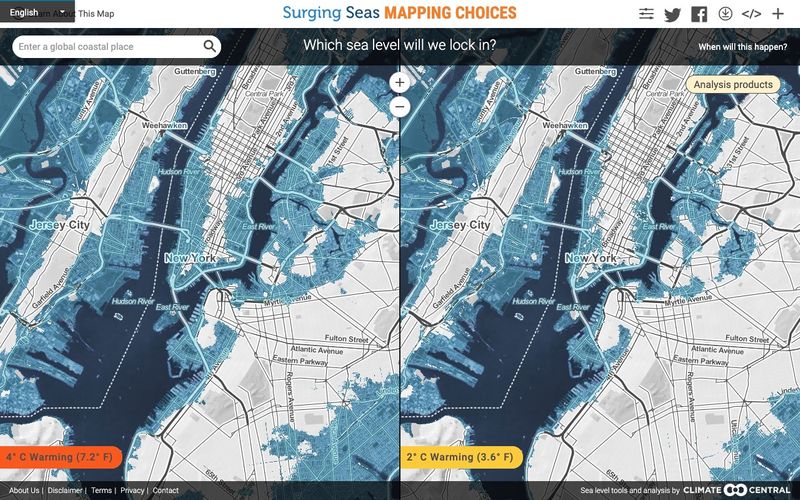
Surging Seas: Mapping Choices
Climate CentralCarbon pollution casts a long shadow ... And the seas will continue to rise ... That’s what these maps are about.
“An independent organization of leading scientists and journalists researching and reporting the facts about our changing climate and its impact on the public. ”
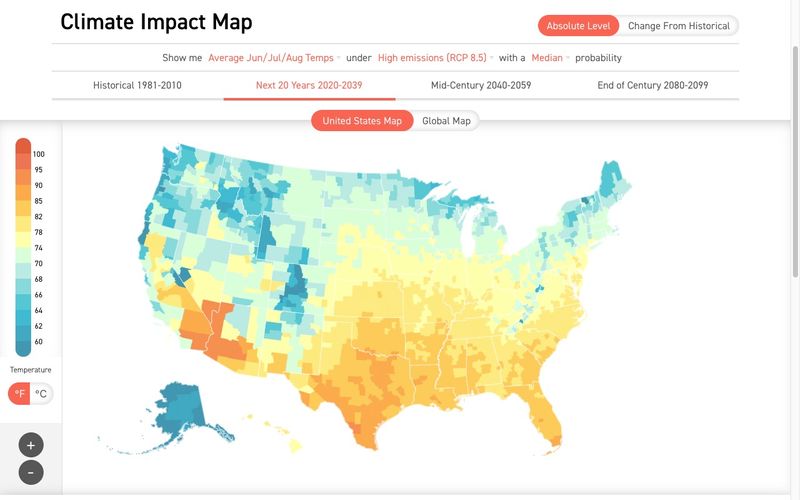
Climate Impact Map
Climate Impact LabExplore the ways Climate Change will impact where you live, work and do business
“The Climate Impact Lab is a unique collaboration of more than 30 climate scientists, economists, computational experts, researchers, analysts, and students from some of the nation's leading research institutions. ”
History and culture
As the modern world embraces development on an ever-increasing scale, cultural and historical traditions are at risk of being forgotten. Interactive maps provide an immersive experience that tells old stories through new technology.
1947 Partition Archive Story Map
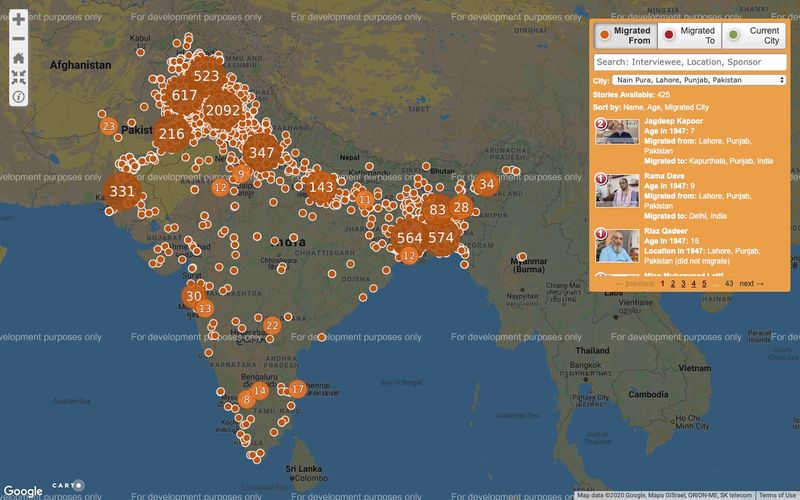
The 1947 Partition ArchiveThis map chronicles thousands of stories from individuals present during the 1947 British Partition of India. It also demonstrates animated migration directions between cities and provides straightforward ways to share individual stories.
“The 1947 Partition Archive is a people-powered non-profit organization dedicated to documenting, preserving and sharing eyewitness accounts from all ethnic, religious and economic communities affected by the Partition of British India in 1947. ”
Stanford Geospatial Network Model of the Roman World
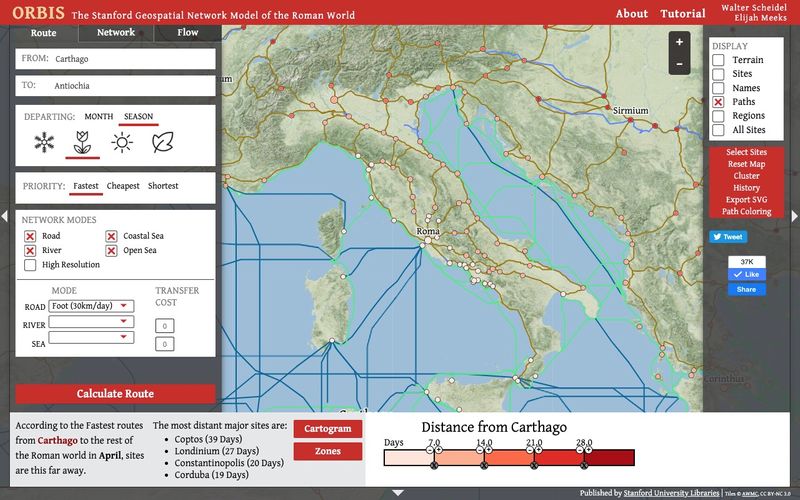
Stanford UniversityFor the first time, ORBIS allows us to express Roman communication costs in terms of both time and expense. By simulating movement along the principal routes of the Roman road network, the main navigable rivers, and hundreds of sea routes in the Mediterranean, Black Sea and coastal Atlantic, this interactive model reconstructs the duration and financial cost of travel in antiquity.
“ORBIS is the result of collaboration between historians and information technology specialists at Stanford University. ”
Hydrology, marine, and watershed science
Over 70% of the Earth's surface is covered in water and about 70% of the human race lives with 5km of water. With rising populations, pollution, and a changing climate, water issues are becoming an increasingly important topic that can be communicated through interactive maps.
Marine Protected Areas
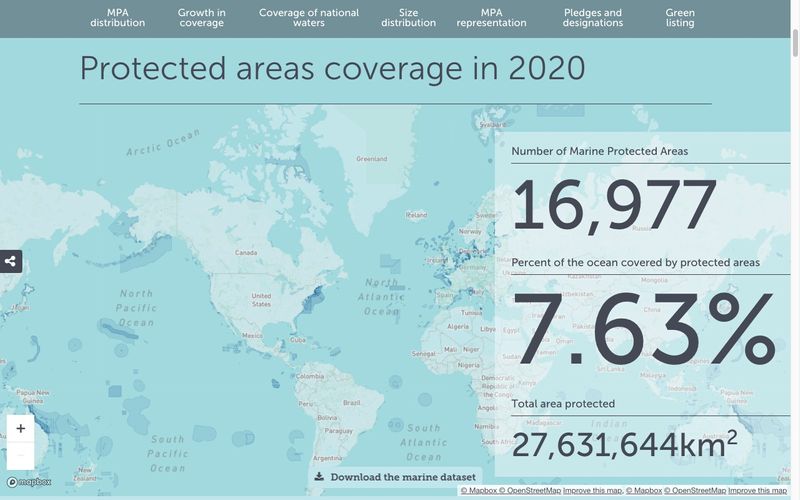
Protected PlanetThis website presents the most recent official coverage statistics for marine protected areas, updated monthly from the World Database on Protected Areas.
“Protected Planet is the most up to date and complete source of information on protected areas, updated monthly with submissions from governments, non-governmental organizations, landowners and communities. ”
Monitoring for Microcystins in Public Lakes
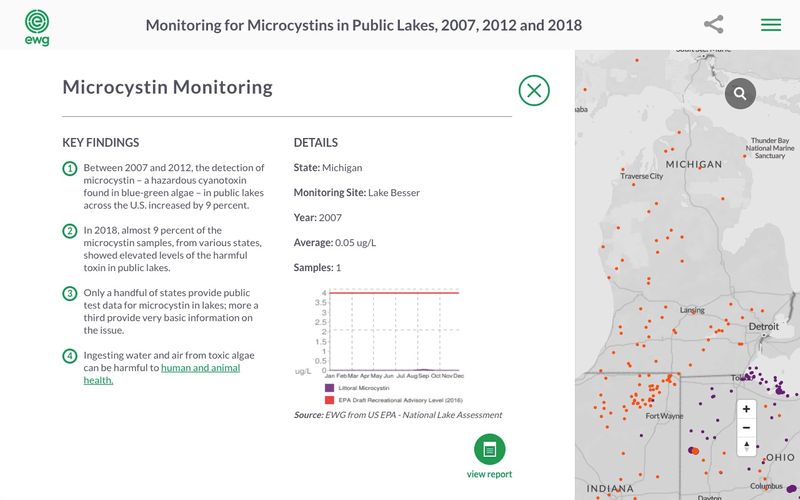
Environmental Working Group... [S]ee location-specific data documenting the detection of microcystins in public lakes from 2007, 2012 and 2018. The approximate locations represent an average of all microcystin detections. ... After EWG completed its survey, the EPA revised its recreational or swimming advisory in May of 2019 ... .
“The Environmental Working Group’s mission is to empower people to live healthier lives in a healthier environment. With breakthrough research and education, we drive consumer choice and civic action. ... We are a non-profit, non-partisan organization dedicated to protecting human health and the environment. ”
